Observable vs. R for data journalism
I’ve been using Observable at work for the best part of a year now, since being introduced to it properly by my colleague Ben. It’s an incredibly well-designed tool with a growing (and very friendly) community of developers and users. In this respect, it resembles my other favoured tool(s) for smaller-scale data analysis: R, and particularly the world of RStudio/the tidyverse.
The similarities are pretty striking, actually. Both tools allow you tap into a huge ecosystem of existing code (npm; CRAN); both include a charting library based on Leland Wilkinson’s Grammar of Graphics (1999) (Plot; ggplot2); both put an emphasis on notebook-style literate programming (Observable’s web interface; RMarkdown); both include collections of UI components that can be easily used for prototyping (Inputs; Shiny); perhaps most important, both were spearheaded by the developer of a wildly popular package for their host language, who now seems somewhat uneasy with his newfound fame (Mike Bostock; Hadley Wickham).
Despite all these similarities, I have encountered a few pain points. Rather than touting Observable’s advantages (ease of sharing notebooks in a team, working directly with JSON, etc.), I thought it might be worth running through my top three frustrations and giving the solutions I’ve come up with, in case they’re useful to others making the same move.
Browser security rules
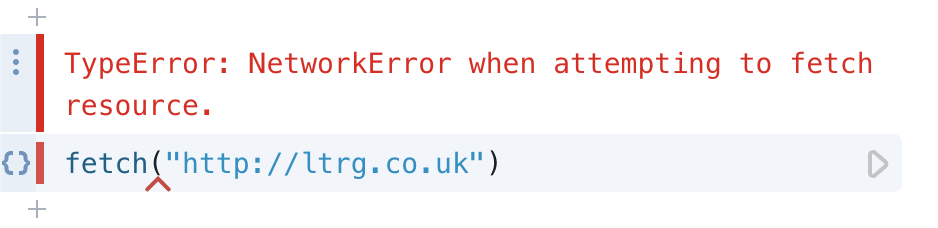
Without a doubt, the biggest pain in the proverbial when switching from local R scripts to Observable’s web interface has been dealing with modern web browsers’ (sensible) rules around networking and security. Want to quickly scrape something from a Brazilian provincial government website that doesn’t use HTTPS? No can do! How about an API that doesn’t serve CORS headers? You’re out of luck.
I’ve found two ways around this. The first is workflow-based: split up your data collection and data analysis and do the ETL work server-side, leaving Observable for the fun stuff. This is what I do for larger projects, taking advantage of Observable’s excellent (and getting excellenter) tools for working with databases. At Global Witness we currently favour a combination of dbt models and GitHub Actions feeding a central Postgres (and, crucially, PostGIS) database on RDS.
The second is simpler but less ‘clean’: set up your own reverse proxy to serve whatever you like over HTTPS, adding the appropriate CORS headers in transit. I’ve done this too, adapting this simple Docker set-up, but generally only use it for accessing Maxar’s WMS endpoint for high-resolution satellite imagery.
Working with tabular data
The approach pioneered by dplyr is rightly held up as a gold standard for working with tabular data in a reproducible way: it’s really well-designed, easy to learn, and works beautifully with the rest of the R ecosystem. And while it’s spawned a few imitators, of which Peter Beshai’s tidy.js is the best, nothing comes close to providing a comprehensive and coherent ‘grammar of data manipulation’…
…except SQL. I’ve found sticking with a database infinitely preferable to working with a JavaScript-based dplyr clone, particularly as for smaller projects a SQLite DB can be attached directly to an Observable notebook. There will always come a point—e.g. right before plotting—at which it’s more sensible to manipulate JSON directly, but when you reach that stage D3.js’s array functions, along with new additions to the ECMAScript spec like Array.prototype.flatMap(), are more than good enough.
Here’s my favourite new pattern for manipulating an array of objects, analogous to a dplyr mutate() call. The flexibility afforded by defining your output as a JavaScript object really helps with things like updating deeply nested GeoJSON properties.
data = [
  { id: 1, width: 200, height: 100 },
  { id: 2, width: 260, height: 130 },
  { id: 3, width: 500, height: 70 }
];

data.map(d => ({
  ...d,
  area: d.width * d.height
}));
Reproducibility and the web
Observable is built around the browser, and this design choice influences how it’s used. While there are many advantages to this approach, it doesn’t make it easy to cache or persist data. Let’s say you’re scraping some data from a web page and manipulating it: in R, I might cache this data as a .Rds file the first time the script runs and re-use this cache (if it exists) subsequently, leaving me with a script that’s clear about the original source of its data (it’ll still contain the relevant httr calls) but that won’t break or spit out incorrect results if the website changes.
I’ve rolled my own solution to this in the form of a little tool which ‘remembers’ any fetch() calls in your notebook and caches them in a SQLite database. You’ll still to need to download the DB file after first run and attach it to the notebook before being able to take advantage of the cache (Observable’s File Attachments are immutable, for good reason), but it solves the problem of stale API endpoints or unreliable websites, and should be pretty fast too. Props to Toph Tucker for the inspiration!
I hope these quick reflections are of use. If you’re someone on a similar technical journey, I’d love to hear about it on Twitter. I’m not a full convert by any means—R still forms a significant part of my day-to-day, and for introducing less technical types to reproducible data workflows it can’t be beat, but I’m looking forward to what’s coming next from Observable HQ!